Metric & data definition
Agree what each measure means, where it comes from and how often it can update.

FRONTBITS / BUSINESS DASHBOARDS
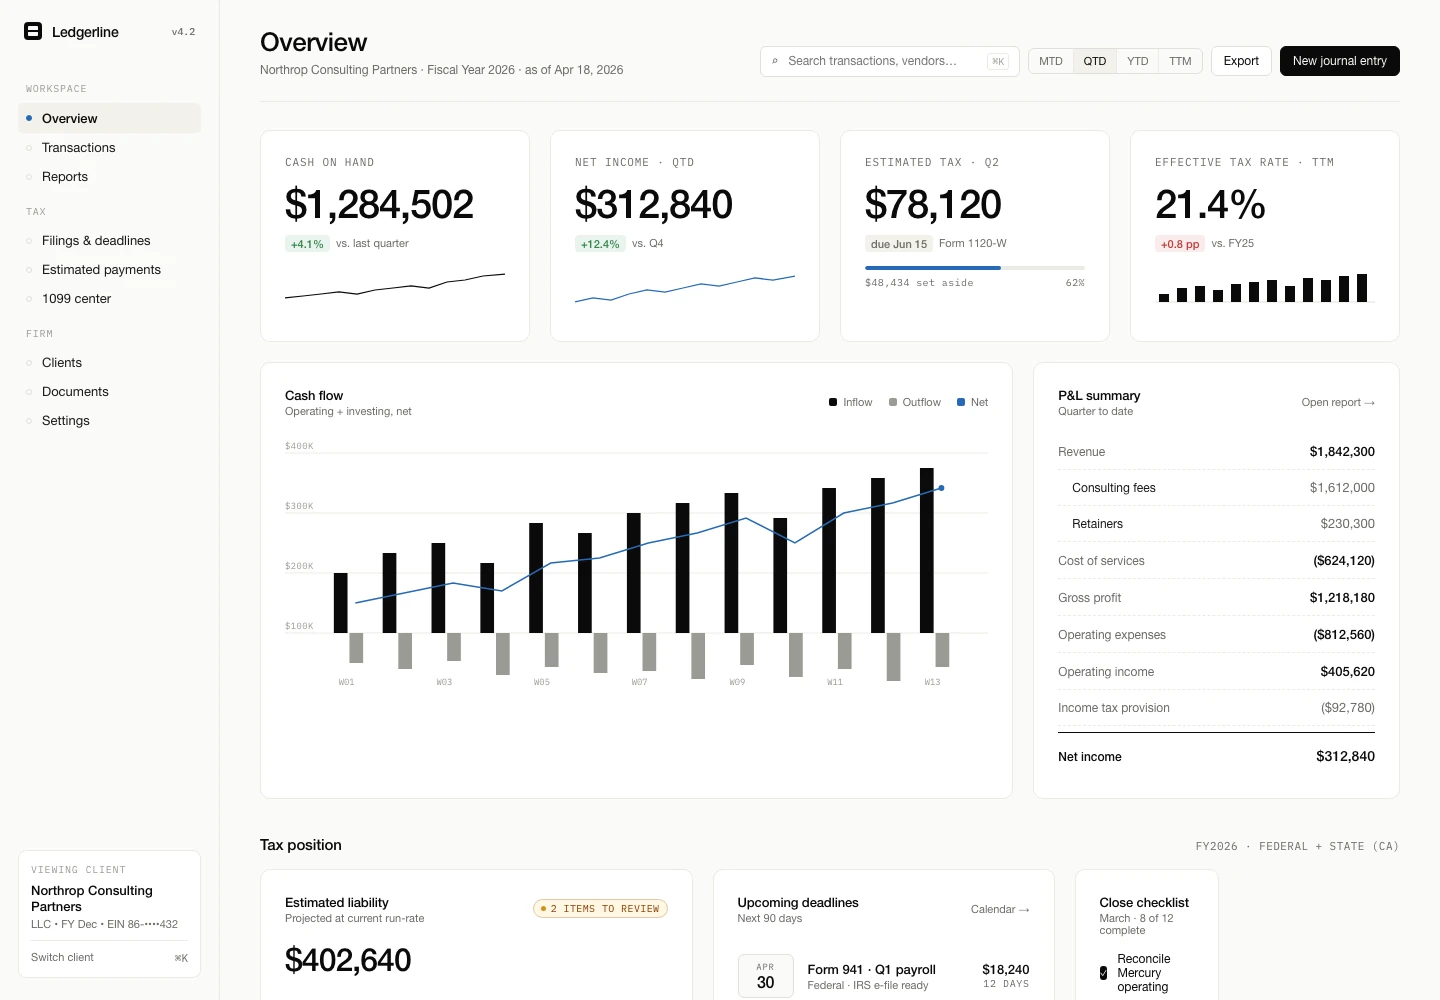
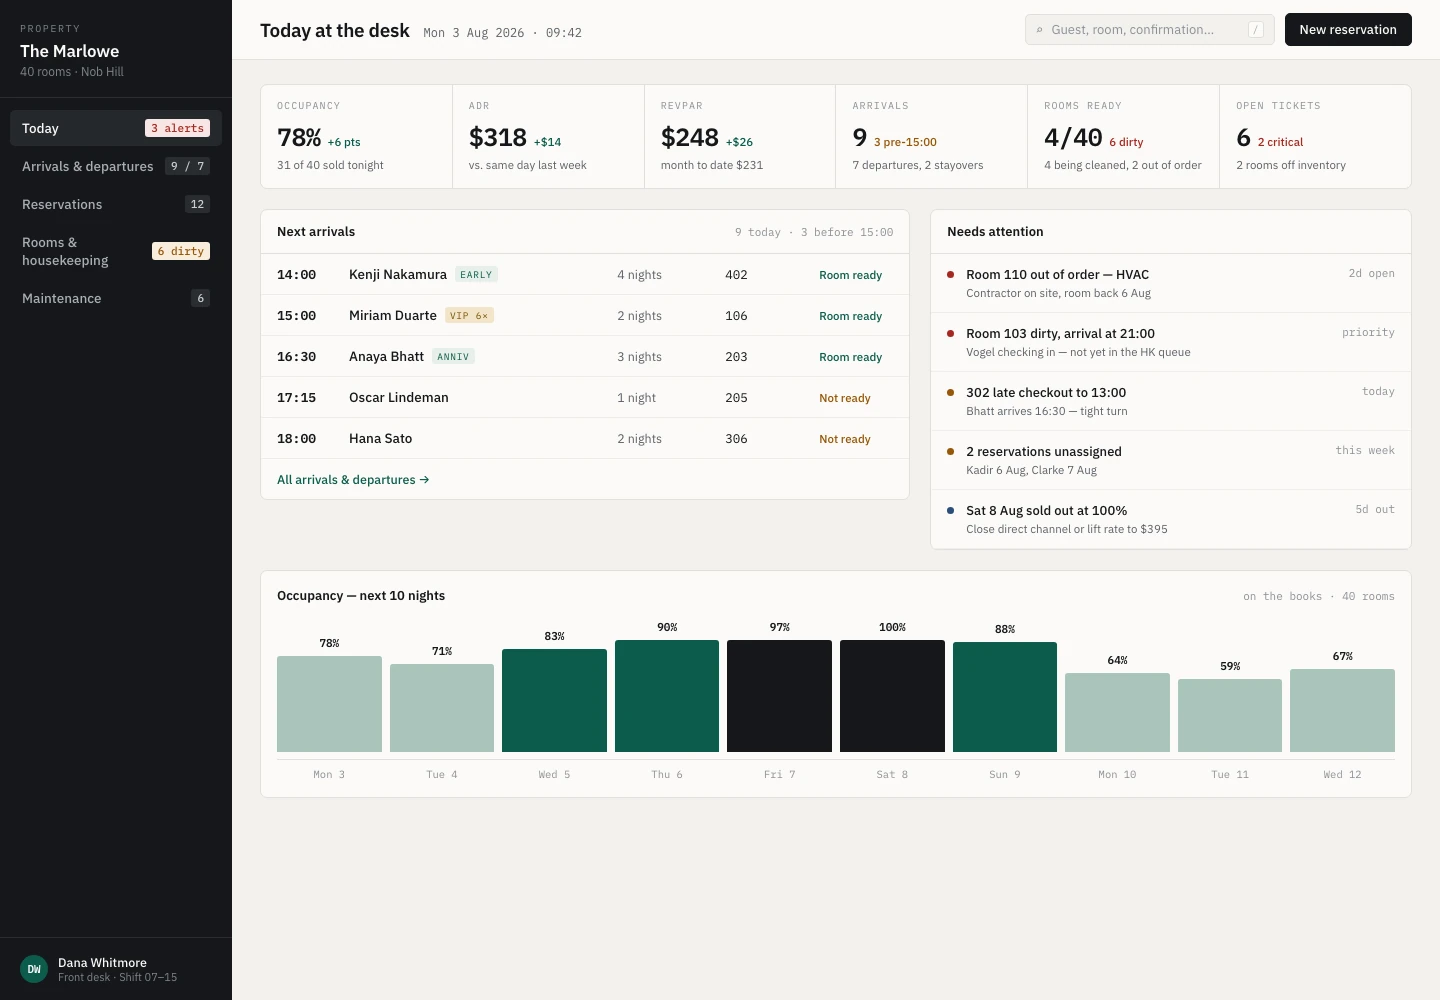
Dashboards and reporting workspaces that bring useful information into one view. Help your team understand priorities, review exceptions and move from a headline figure to the work behind it.
Discuss your project ↗IS THIS THE RIGHT FIT?
For operations leaders who spend too much time preparing reports or piecing together the status of work across several tools.
WHAT WE CAN BUILD TOGETHER
Agree what each measure means, where it comes from and how often it can update.
Arrange priorities, comparisons and exceptions around the decisions the team needs to make.
Build agreed data connections, filters and detail views with suitable access controls.
A PRACTICAL EXAMPLE
A manager checks several spreadsheets to find overdue tasks and pending approvals.
A shared view highlights those items and links each one to its owner and supporting detail.
The team can review priorities from a consistent view instead of rebuilding the report.
What needs attention
PLANNING YOUR PROJECT
We agree scope, price, milestones, integrations and handover expectations before work begins. Support arrangements are discussed during planning.
See our process →EXPLORE THE INTERFACES
BEFORE WE BEGIN
Refresh frequency depends on the source systems, integration options and business need. We agree it during planning.
Yes. Existing reports help us understand definitions and identify which views are useful, missing or duplicated.
YOUR NEXT STEP
For founders, business owners and operations leaders considering Business dashboards.
Share what you want to improve, how things work today and any constraints. A website link, workflow example or short feature list is useful; a finished brief is not required.
We’ll discuss fit, priorities and what we need to understand before proposing a scope.
Book a project call ↗Opens Cal.com. Prefer to write first? hello@frontbits.com